Edit and Debug Alchemy Scripts |
Learn more about Verizon Connect GeoBase.
Get information about the latest release
Alchemy scripts can be edited and debugged within Verizon Connect GeoBase WorkBench. To edit a script, open the relevant file as outlined in 'Opening Script Files' in the Open Alchemy Data and Script Files section and edit the file as appropriate.
The debugger allows you to place multiple breakpoints, and the ability to explore the script using the debugging features: Debug / Run, Skip, Step Into, Step Out, and Stop.
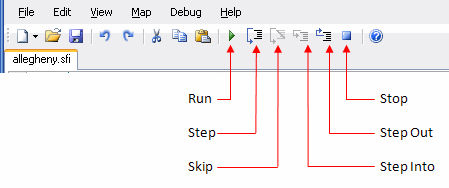
Figure 1
Set breakpoints by clicking on the breakpoint margin to the left of the code. When you are ready to debug the script, click Run in the Alchemy Debug Toolstrip. This will execute the script and WorkBench will display the Alchemy Console, Watches, and Variables windows. For more details about these windows see the 'Alchemy Debug and Information Windows' section, below.
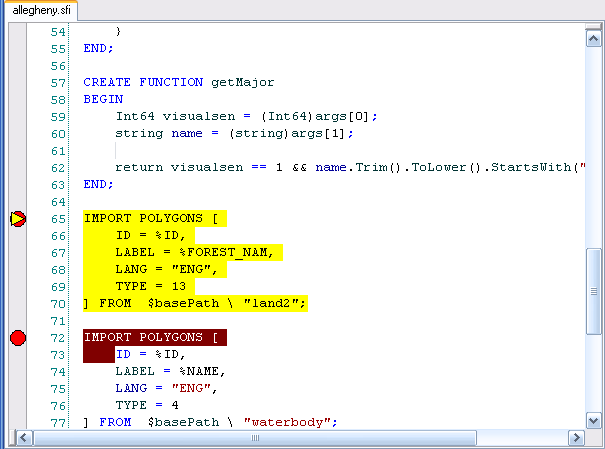
Figure 2
Alchemy's Debug and Information Windows
Alchemy provides a number of debug and information windows to help with the script debugging process. All these windows can be resized, and placed either inside, or outside of the WorkBench application.
Warnings
The Warnings window is displayed automatically after a successful run of an Alchemy script, displaying a list of warnings that have been generated during the GBFS build. The warnings are also automatically saved to a text file in the output folder.
Console
The console displays the Alchemy output that would be seen on a console if Alchemy was run from the command line.
Variables
The Variables window is tabbed with the Watches window. While debugging a list of the current variables and their values are displayed.
Watches
The Watches window allows you to add and monitor expressions that get evaluated each time the debugger pauses.
This window can be used to view any valid expression which returns a value, for example string.contains(%trailtype, "hiking") to return a boolean or %trailtype to return the actual value. When stepping through the code the expression value will be displayed in the Value column. Note that when using a function, column names are case-sensitive.
Debug Properties
The Debug Properties window is used to set command line arguments for debugging an Alchemy script. To open the window, click on View | Debug Properties.
Breakpoints
The Breakpoints window displays the current breakpoints in the script. If your script is lengthy, then this can be useful for locating specific breakpoints with ease: double-click on a breakpoint line number in the Breakpoints window, and the editor will center in on the relevant part of the script.
The Breakpoints window displays three columns: Line, Text, and Condition. Line and Text are read-only. Condition is editable.
Type a condition into the Condition column and breakpoints will be inserted automatically whenever the specified conditions are met. For example string.contains(%trailtype, "hiking") or string.contains(%road_name, "Aliso Viejo") will halt the code at the point that these are true.
To open the window, click on View | Breakpoints.
Immediate Window
The window is used to evaluate expressions and statements as debugging is taking place. To open the window, click on View | Immediate Window.