Map Concept |
Learn more about Verizon Connect GeoBase.
Get information about the latest release
There are two ways to generate and use maps in GeoBase:
- By placing an active MapCtrl control on a form
- By using the Map object and its GetMap() method
Maps can render additional objects (such as icons) by using a RendererList. A RendererList object is a collection of objects that implement the IMapRenderer interface - such as informational BalloonPushPin or TrafficRenderer (indicates traffic congestion) or PoiRenderer (draws points of interest such as restaurants and golf courses).
Creating an Application Using the Map Control
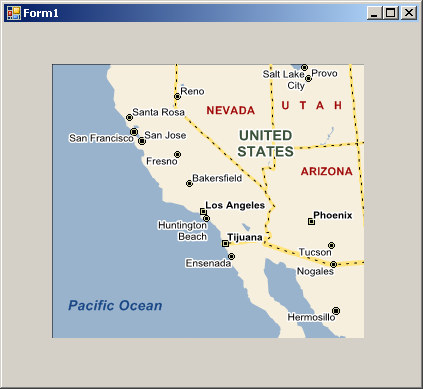
Create a simple mapping application: Map Explorer Lite.
Placing a MapCtrl control on an empty form is the quickest (and most common) way to add a GeoBase map to your application. The control supports mouse-based panning and zooming and contains several methods that allow its appearance and behavior to be tailored.
Some commonly-used MapCtrl methods are listed below:
Method Name | Method Header | Description |
public LatLon Center{ get; set; } | Locate/define the center of the map in terms of latitudinal and longitudinal coordinates. | |
public DragBehavior{ get; set; } | DragBehavior: DragBehavior.None DragBehavior.Box (zoom) DragBehavior.Hand (drag) | |
public void LatLontoXY(out int x, out int y, LatLon loc) | Convert latitudinal and longitudinal coordinates to pixel coordinates, with the origin at the top left of the frame. | |
public double PixelSizeMeters { get; } | Returns the number of meters per pixel. | |
public double PixelSizeMiles { get; } | Returns the number of miles per pixel. | |
public bool Projected { get; set; } | When true the map is displayed as if it were projected onto a sphere. Otherwise the map is displayed as if it were laid flat. | |
public IMapRenderer Renderer { get; set; } | Assign an IMapRenderer object to the map. | |
public bool DoubleBuffering { get; set; } | When DoubleBuffering is false map labels are rearranged to prevent overlaps. Turning DoubleBuffering on will result in a slight performance increase, at the expense of potentially garbled map labels. | |
public bool UiEnable { get; set; } | Setting UiEnable to false disables user-initiated panning and zooming on the map. | |
public double Zoom { get; set; } | A higher zoom value corresponds to a wider view. Several useful zoom values are defined in the ZoomLevel class, such as ZoomLevel.AllUSA and ZoomLevel.StreetLevel. | |
public LatLon XYtoLatLon(int x, int y) | Converts pixel (screen) coordinates to latitudinal and longitudinal coordinates. |
The Map class is a layer below the MapCtrl class. The advantage of the Map class (over MapCtrl) is greater flexibility and control, as the tasks of generating and displaying a map are separated. The Map() method handles map generation and supports all of the MapCtrl methods listed above, except the ones that deal solely with displaying a map (ie. DragBehavior(), SmartLabeling() and UiEnable()). Map display properties are handled separately by the GetMap() method.
Descriptions of Map() and GetMap() are given below.
Method Name | Method Header | Description |
public Image GetMap() | Generates a System.Drawing.Image object from the map using the current map center, size and zoom. | |
public Map(LatLon Center, int Width,int Height, double Zoom) | The Map constructor. If the input arguments are omitted then the following defaults are used:
|
The syntax linking the Map() and GetMap() methods is demonstrated in the following code fragment:
LatLon location = new LatLon(34.0000, -118.0000);
/* Create a 256 x 256 pixel map centered at (34, -118) */
using(Map map = new Map(location, 256, 256, ZoomLevel.AllUSA)) {
    /* Create an image from the map and save it as c:\map.png */
    map.GetMap().Save(@"C:\map.png");
}
The MapCtrl object operates in two modes: local mode (data files located on the local machine) and GeoStream mode (data files located on a remote server). The operation mode is controlled by setting Repositories.Repository.CurrentThreadRepository to either a SimpleRepository or MultiRepository (local mode) or a GeoStreamRepository (GeoStream mode).
When in local mode you should use the Zoom, MaxZoom and MinZoom properties to control the zoom of a MapCtrl. Zoom is a double value in the range 0.1 to 18000. These values represent the distance between the left and right edges of the visible map (measured in degrees) multiplied by 50. Zoom cannot be greater than 18000 because the earth only has a circumference of 360 degrees. The Zoom value can be thought of as an altitude value -- the larger Zoom is, the greater your altitude and the more you can see of the world. The MaxZoom and MinZoom properties control the maximum and minimum values (respectively) that Zoom can take.
When in GeoStream mode, the Zooms and ZoomLevel properties control the available zooms of a MapCtrl. The ZoomLevel is an index into the Zooms array (and therefore must be an integer value, 0 or greater). Zooms is an array of zoom values (in ascending order), where each value represents the number of supertiles required to span the world horizontally. (A supertile is a square collection of map tiles that the server returns as a single unit.) By modifying the first and last elements of the Zooms array the maximum and minimum zoom values can be controlled. When in GeoStream mode you can still use the Zoom property, however using Zoom will cause the MapCtrl to zoom to the closest available ZoomLevel that is as big or larger than the requested Zoom value.
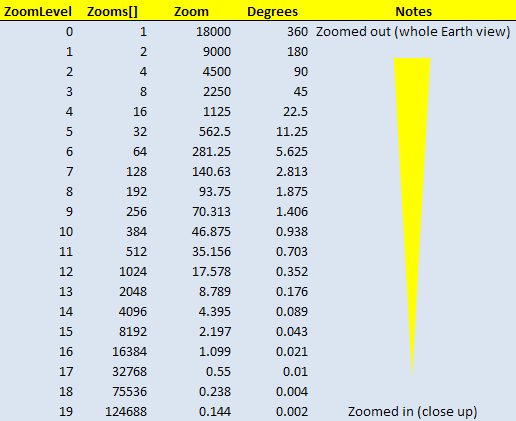
The simplest way to control the zoom level of the map is to use the Zoom property (small values near, large values far). This will work in both local and GeoStream modes. The table below shows the correlation between ZoomLevel, Zooms, Zoom and the map coverage in degrees.
In summary:
- The Zoom property controls the map zoom in both local and GeoStream modes. Zoom is a double value in the range 0.1 to 18000. These values represent the distance between the left and right edges of the visible map (measured in degrees) multiplied by 50. This means a greater Zoom value represents a higher altitude and therefore a greater view of the world. When operating in GeoStream mode the Zoom values are rounded up to match the nearest corresponding value in the Zooms array.
- The MaxZoom and MinZoom properties control the maximum and minimum allowable Zoom values when the MapCtrl is operating in local mode.
- Zooms is an array of zoom values, where each value represents the number of supertiles required to span the world horizontally. This means that a larger value is a closer (nearer) zoom. The values in the array are arranged from smallest to largest. By modifying the first and last elements in the array the minimum and maximum zoom levels can be controlled.
- The ZoomLevel property is an index into the Zooms array. When operating in GeoStream mode and the ZoomLevel property is modified, the map zooms to the zoom level specified at the corresponding index of the Zooms array.
GeoBase offers two modes of projection: Mercator and Lambert azimuthal equal-area. In general, GeoStream maps are always displayed with the Mercator projection, while, in contrast, locally generated maps (MapCtrl) can be either Mercator or Lambert, depending on both the map's scale, and the Projected property setting. To set the projection of a MapCtrl to Lambert, set the Projected property:
MapCtrl myMap = new MapCtrl();
myMap.Projected = True;
However, regardless of the value of the Projected property, when a MapCtrl map is zoomed past Zoom 3200, the projection setting is ignored and will be displayed with the Mercator projection, as it is with the GeoStream map. The reason for this is that the Lambert projection becomes very distorted when a large proportion of the Earth is visible.
Mercator projected maps also suffer from distortion which is more noticeable the further a point is from the Equator. The distortion of Mercator means that the scale will change as the latitude of the center of the map changes. Scale is defined as the number of meters per pixel along the parallel (east-west axis) at the center of the map. Scale can be calculated from:
scale = circumference of earth / tiles per supertile / pixels per tile / zoom
So if a MapCtrl map is centered on the Equator, then a scale of 33396 equates to zoom 1:
scale = 40075000 / 4 / 300
= 33396
Where 40075000 is the approximate circumference of the earth in meters at the Equator.
A scale of 16698 equates to zoom 2:
40075000 / 4 / 300 / 2
= 16698
When a MapCtrl map is zooming in, and if the Projection is set to Lambert, then the display will switch from Mercator to Lambert at Zoom 3200 (when centered on the Equator). When using the Lambert projection, the scale is constant as the latitude changes. However, there will be a difference in the way the map looks compared to the GeoStream map; this difference becomes less noticeable as the map is zoomed in, until at a certain zoom level, the two maps are essentially identical.
Wherever the map is centered in Lambert projection, the equation above applies. For example, a scale of 2087 equates to zoom 16 (ZoomLevel 4).