Clustering Concept |
Learn more about Verizon Connect GeoBase.
Get information about the latest release
Sometimes, you may want to show features on the map that are so numerous that the map becomes too cluttered when the zoom level is not very high. Clusters allow you to solve this problem by combining nearby features into 'clusters', where each cluster represents multiple map features.
For example, consider the following map, which displays every POI (point of interest) in the displayed region:
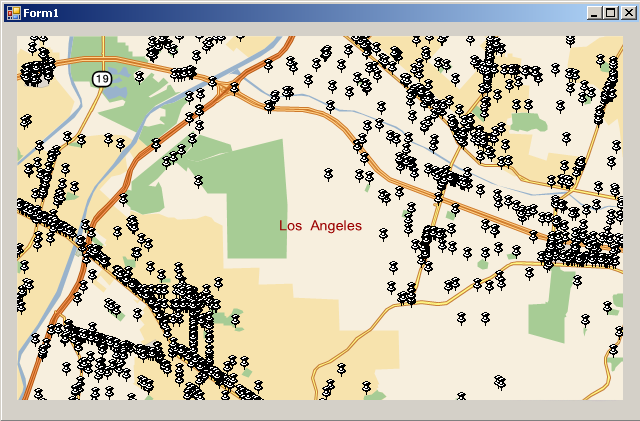
The map looks very cluttered, and in places, it is hard to see individual POIs because they are drawn on top of each other.
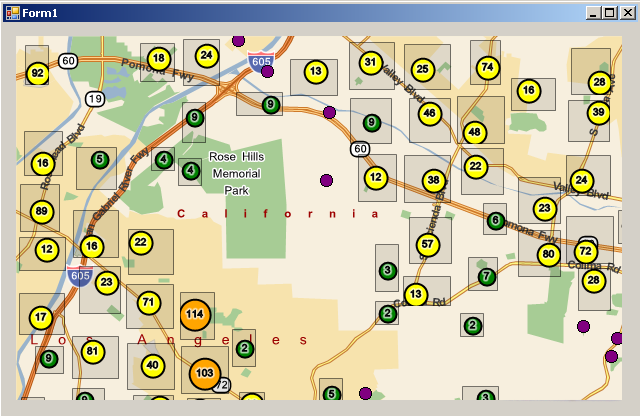
The map below shows the same POIs, but this time, they have been grouped into clusters:
Support for clustering map features is highly configurable, allowing you to specify:
- The algorithm to use for determining which features on the map are clustered together. Each clustering algorithm is an object that implements the IClusteringAlgorithm interface. By default, GeoBase includes one clustering algorithm, ColumnClustering. In addition, you can write your own clustering algorithms.
- The data to be clustered. This data is supplied by an object that implements the IPointFeatureSource interface. The ADODataSource is a built-in point feature source that you can use to retrieve your data from a database, CSV file, or other ADO.NET data source.
- The representation of clusters that are rendered on the map. Cluster representations are generated as images by an object that implements the IClusterVisualization interface. A cluster visualization object optionally makes use of a user-defined object that represents the information that a cluster summarizes. The clustering algorithm generates these user-defined summary objects by calling a ClusterSummaryDelegate and assigning the resulting object to a Cluster. GeoBase includes two visualization objects that you can use for displaying clusters: ClusterVisualizationDot, which represents clusters as a simple dot labeled with the number of items in the cluster, and ClusterVisualizationPieChart, which represents clusters as nested pie charts. The pie chart visualizer requires a summary object (PieChart). In addition, you can use the abstract ClusterVisualization class as a base class when defining your own visualization objects.
Create a simple Windows Forms application that uses a local cluster layer to create clusters for points of interest.
Clusters are created and managed by a cluster layer. There are two types of cluster layers:
- LocalClusterLayer generates clusters based on data supplied by an IPointFeatureSource. When you add a local cluster layer to your application, you supply it with a clustering algorithm such as ColumnClustering, an IPointFeatureSource that supplies the data to cluster, a ClusterSummaryDelegate to generate summary objects based on the features in each cluster, and a cluster visualization object such as ClusterVisualizationDot or ClusterVisualizationPieChart.
- RemoteClusterLayer fetches clusters from a server application, using a URL that is supplied to the constructor. The server does not need to be a GeoStream server, but must contain a ClusterPage that handles incoming requests for clusters.
When your application has a cluster layer, you can use a ClusterRenderer to render the clusters on the map. To do this, supply your cluster layer to the ClusterRenderer constructor, assign the cluster renderer to a map, and clusters are automatically drawn on the map. As the features that define clusters change, the clusters drawn on the map automatically update to display the changed clusters.