Benchmarking a Script |
Learn more about Verizon Connect GeoBase.
Get information about the latest release
Chameleon gives you a large amount of flexibility in terms of what and how various map features are rendered, so it is often important to be aware of the performance of the style. TWB assists in this process by providing a number of benchmarking tools.
As you develop your style, the time the current map takes to render is displayed in the lower right corner on the status bar. To get an indication of which parts of your style are slowest, you can run the benchmark tool (Map | Run Benchmark or Ctrl+Shift+F5). This will run your style at a range of zoom levels, and record the time for each one. It then displays the result as a graph:
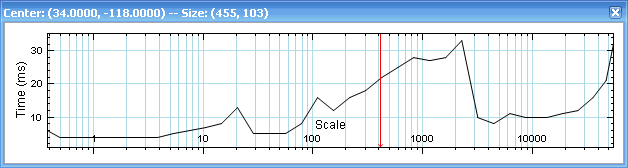
You can click on the graph and be taken straight to the appropriate zoom level. Double clicking will re-run the benchmark for the particular zoom under the cursor.
Rendering time may be increased if you use high polygon detail settings at low zoom value (detail should typically only be increased at lower levels) or if layers that are normally displayed only at higher magnification levels, such as surface streets, are displayed at lower magnifications.
When layers appear as large masses of onscreen information with no apparent detail, the layer may require optimization for that magnification level.