Adding a Traffic Layer |
Learn more about Verizon Connect GeoBase.
Get information about the latest release
This tutorial demonstrates how to add a traffic layer to a GeoStream map.
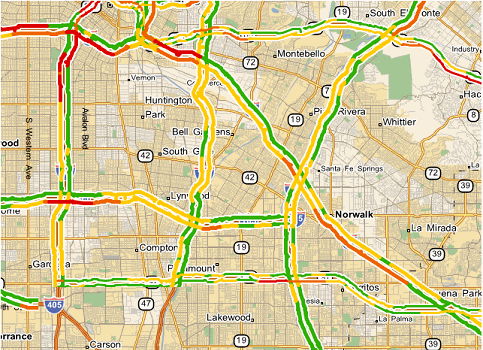
A traffic layer displays the average traffic speed along a link, as a fraction of the speed limit along the link, with the fraction determined by the speed limit of the link. The average traffic speed can be obtained from real-time or historical data. Groups of links may be colored red (slowest traffic), orange, yellow, or green (fastest traffic) - see Figure 1.
The table below shows the default color key. Note that these fractions, and the speed limits at which they apply, can be manually adjusted if needed (see Traffic Styles below).
| Color | Fraction of speed limit <40MPH | Fraction of speed limit >65MPH |
|---|---|---|
| Red | <20% | <31% |
| Orange | <38% | <62% |
| Yellow | <56% | <92% |
| Green | >=56% | >=92% |
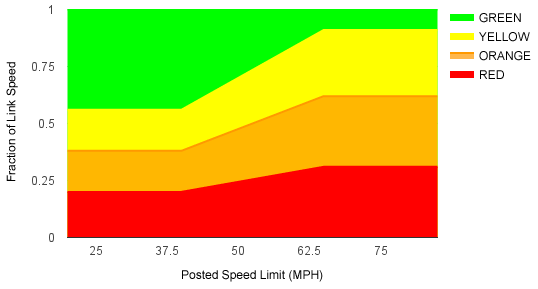
At speeds above 40MPH and below 65MPH, the average fraction of the speed limit vehicles must travel at in order to color links adjusts linearly between the 40MPH fraction and the 65MPH fraction, as illustrated in the diagram below:
This tutorial will be carried out in three steps:
- Firstly, we will use the code from the tutorial Creating a Simple Map, and add two more lines of code for the traffic layer.
- Next, we need to add a key-value pair to the 'web.config' file
- Finally, we will add paths for the traffic data sources, to the TrafficConfig file
Open the first tutorial, Creating a Simple Map, and copy the code to a text editor.
We need to create a map layer object from the Telogis.GeoBase.MapLayers namespace. Add the following code:
var MapLayers = GeoBase.MapLayers;
...
...
new MapLayers.TrafficLayer({map: map, id: 'main_map_traffic', source: 'TrafficData'});
See the Full Code section for a full code listing which you can copy and paste into your project.
Ensure that the following key-value pair exists in the 'web.config' file:
<add key="TrafficConfig" value="traffic.config" />
Finally, add the traffic layer data source path(s), to the TrafficConfig file. Here we are stating the traffic data source, the page refresh rate (every 20 minutes in our example), and whether or not the data needs decompressing. As an example, add the following code:
<?xml version="1.0" encoding="utf-8" ?>
<Traffics>
  <Traffic ID="TrafficData"
           Refresh="00.00:20:00"
           xmlns:gb="Telogis.GeoBase.Traffic">
    <gb:InrixRealTimeTrafficSource Url="http://traffic.geobase.info/MarketLAXRealTimeTraffic.xml.zip" Zipped="true" />
  </Traffic>
</Traffics>
Additionally, or alternatively, you may add a local path to a data source containing historical data - for example:
<?xml version="1.0" encoding="utf-8" ?>
<Traffics>
  <Traffic ID="TrafficData"
           Refresh="00.00:20:00"
           xmlns:gb="Telogis.GeoBase.Traffic">
    <gb:InrixRealTimeTrafficSource Url="http://traffic.geobase.info/MarketLAXRealTimeTraffic.xml.zip" Zipped="true" />
    <gb:HistoricalTrafficSource DataPath="C:\GeoBase\data\gb.3.0\HistoricalTraffic.gbht"/>
  </Traffic>
</Traffics>
If you're using a compressed data source you may need to add a reference to an external component, such as 'ICSharpCode.SharpZipLib.dll', to decompress the data. |
Run your code, and ensure that your map is similar to that of Figure 1. If you have any problems, then see the article Troubleshooting a GeoStream Server which offers some suggestions for various fault modes.
<%@ Page Language="C#" Src="AuthenticatedPage.aspx.cs" Inherits="AuthenticatedPage" %>

<html xmlns="http://www.w3.org/1999/xhtml">
<head>
<title>Simple Map Demo</title>

<script type="text/javascript" src="<% GetAPISource (); %>"></script>
<script type="text/javascript">

var main = function () {

    var GeoBase   = Telogis.GeoBase;
    var MapLayers = GeoBase.MapLayers;
    var Map       = Telogis.GeoBase.Widgets.Map;
    var Size      = Telogis.GeoBase.Size;

    // The call to set the internal GeoBase authentication token should be made at
    // the start of the entry function, as it is a prerequisite for any requests
    // made to the server.

    GeoBase.setService (<% GetService (); %>);
    GeoBase.setAuthToken (<% GetToken (); %>);

    // By default, a newly created map object has its DOM tree appended to the
    // document body. To customize where the map is located, either create in the
    // HTML section a div with the same ID, or specify a "parent" configuration option.

    var map = new Map ({id: "main_map", size: new Size (640, 480)});
    new MapLayers.TrafficLayer({map: map, id: 'main_map_traffic', source: 'TrafficData'});
};

</script>
</head>
<body onload="main ();">
</body>
</html>
The default traffic style can be overridden with your own custom style.
To create a custom traffic style, you will need to create a definition for the style in a Chameleon map style file (*.cam), and then add a 'style' attribute to a Traffic element within the TrafficConfig file. The 'style' attribute points to the Chameleon file; the specified path is relative to the server's root.
For example, in 'myTrafficStyle.cam', we can add our new custom traffic style definition:
DECLARE %streetMax = 100
DECLARE %farDetail = 80
DECLARE %stateZoom = 60
DECLARE %countyZoom = 50
DECLARE %bigCityZoom = 30
DECLARE %noOffset = 2

#define $(traffic)
    [{class:1, limit:0.31, limitSpeed:65, lowLimit:0.20, lowLimitSpeed:40, color:(222,0,0)},
     {class:2, limit:0.62, limitSpeed:65, lowLimit:0.38, lowLimitSpeed:40, color:(239,102,0)},
     {class:3, limit:0.92, limitSpeed:65, lowLimit:0.56, lowLimitSpeed:40, color:(255,204,0)},
     {class:4, color:(51,177,0)}]
#end

begin map
        begin streets linkwise
                !w = (255,255,255)
                #foreach $(traffic) => $(cat)
                        IF %scale >= %streetMax
                                render [SUPER:$(cat.class)]: offset=2;singleDigitisedStreetOffset=2, [pen<!w,5>,pen<$(cat.color),2>],null,null
                                render [MAJOR:$(cat.class)]: offset=2;singleDigitisedStreetOffset=2, [pen<!w,4>,pen<$(cat.color),1>],null,null
                        ELSE IF %scale >= %farDetail
                                render [SUPER:$(cat.class)]: offset=3;singleDigitisedStreetOffset=3, [pen<!w,6>,pen<$(cat.color),3>],null,null
                                render [MAJOR:$(cat.class)]: offset=2;singleDigitisedStreetOffset=2, [pen<!w,4>,pen<$(cat.color),1>],null,null
                        ELSE IF %scale >= %stateZoom
                                render [SUPER:$(cat.class)]: offset=4;singleDigitisedStreetOffset=4, [pen<!w,7>,pen<$(cat.color),4>],null,null
                                render [MAJOR:$(cat.class)]: offset=2;singleDigitisedStreetOffset=2, [pen<!w,5>,pen<$(cat.color),2>],null,null
                        ELSE IF %scale >= %countyZoom
                                render [SUPER:$(cat.class)]: offset=5;singleDigitisedStreetOffset=5, [pen<!w,7>,pen<$(cat.color),4>],null,null
                                render [MAJOR:$(cat.class)]: offset=4;singleDigitisedStreetOffset=4, [pen<!w,5>,pen<$(cat.color),2>],null,null
                                render [SECONDARY:$(cat.class)]: offset=1;singleDigitisedStreetOffset=1, [pen<!w,4>,pen<$(cat.color),1>],null,null
                        ELSE IF %scale >= %bigCityZoom
                                render [SUPER:$(cat.class)]: offset=6;singleDigitisedStreetOffset=6, [pen<!w,9>,pen<$(cat.color),6>],null,null
                                render [MAJOR:$(cat.class)]: offset=4;singleDigitisedStreetOffset=4, [pen<!w,7>,pen<$(cat.color),4>],null,null
                                render [SECONDARY:$(cat.class)]: offset=2;singleDigitisedStreetOffset=2, [pen<!w,5>,pen<$(cat.color),2>],null,null
                        ELSE IF %scale >= %noOffset
                                render [SUPER:$(cat.class)]: offset=6;singleDigitisedStreetOffset=6, [pen<!w,9>,pen<$(cat.color),6>],null,null
                                render [MAJOR:$(cat.class)]: offset=4;singleDigitisedStreetOffset=4, [pen<!w,7>,pen<$(cat.color),4>],null,null
                                render [SECONDARY:$(cat.class)]: offset=4;singleDigitisedStreetOffset=4, [pen<!w,7>,pen<$(cat.color),4>],null,null
                                render [ARTERIAL:$(cat.class)]: offset=2;singleDigitisedStreetOffset=2, [pen<!w,5>,pen<$(cat.color),2>],null,null
                        ELSE
                                render [SUPER:$(cat.class)]: offset=8;singleDigitisedStreetOffset=8, [pen<!w,11>,pen<$(cat.color),8>],null,null
                                render [MAJOR:$(cat.class)]: offset=6;singleDigitisedStreetOffset=6, [pen<!w,9>,pen<$(cat.color),6>],null,null
                                render [SECONDARY:$(cat.class)]: offset=6;singleDigitisedStreetOffset=6, [pen<!w,9>,pen<$(cat.color),6>],null,null
                                render [ARTERIAL:$(cat.class)]: offset=6;singleDigitisedStreetOffset=6, [pen<!w,9>,pen<$(cat.color),6>],null,null
                        END
                #end
        end
end
In the code above, we have set each class with two fractional threshold values (limit and lowLimit), two speed values that specify whether either of the two thresholds should apply (LimitSpeed and lowLimitSpeed), and a corresponding RGB color value used to color links when the threshold has been met.
limitSpeed defines the speed, in MPH, above which the limit threshold applies. lowLimitSpeed defines the speed, in MPH, below which the lowLimit threshold applies. For posted speed limits between LimitSpeed and lowLimitSpeed (between 40MPH and 65MPH in the code above), the threshold at which the specified color will be used is interpolated linearly between lowLimit and limit.
The first class above states that at speeds below 40MPH, a link will be colored red (222,0,0) whenever the movement of traffic on that link is traveling at less than 20% of the posted link speed. At speeds of 65MPH or above, the same link will be colored red only when the movement of traffic on that link is traveling at less than 31% of the posted link speed. Between 40MPH and 65MPH, the threshold will increase linearly from 20% at 40MPH to 31% at 65MPH.
Note: there is no limit to the number of classes that you can define.
Next, we need to add a 'style' attribute to the Traffic element within the TrafficConfig file, to point to the 'myTrafficStyle.cam' file with our new 'traffic' definition. The style attribute should look something like this:
<?xml version="1.0" encoding="utf-8" ?>
<Traffics>
   <Traffic ID="TrafficData"
           Refresh="0:15"
               xmlns:gb="Telogis.GeoBase.Traffic"
               style="myTrafficStyle.cam">
     <gb:InrixRealTimeTrafficSource
            Url="http://traffic.geobase.info/MarketLAXRealTimeTraffic.xml.zip"
            Zipped="true" />
    </Traffic>
</Traffics>
This tutorial has demonstrated the ease of adding a traffic layer to a GeoStream map application. However, in this simple code example, the addition of the traffic layer can obscure the highway shields. Using Chameleon Custom Map Styles you can overcome this effect by rendering the shields onto an auxiliary layer. To achieve this, we will modify the code above.
First, update the map object forcing the map to be drawn on layer 0:
Change:
var map = new Map ({id: "main_map", size: new Size (640, 480)});
To:
var map = new Map ({id: 'main_map', size: new Size (640, 480), tileLayerConfig:{tileConfig:{args:{auxlayer: '0'}}}});
We will need to create a new TileLayer for the shields. Add the following code which will create the TileLayer object and display the auxiliary layer:
var TileLayer = Telogis.GeoBase.MapLayers.TileLayer;
...
new TileLayer ({id: 'main_map_auxiliary', map: map, tileConfig:{args: {auxlayer: '1'}}});
It is important to note that the Label Objects property auxiliarylayer is enabled in the default map style included with GeoBase.
However, if and when you create your own .cam map style files using Verizon Connect GeoBase WorkBench, this property will not be enabled by default in any new map styles. In other words, if you intend to use auxiliary layers with your own custom map style, you must activate this property manually.
The steps required to manually enable auxiliary layers in a .cam file are detailed in the following tutorial, Auxiliary Layers. |
The Label Object is described as follows:
LABEL<FONT[, buffer[, mindist[, priority[, auxiliarylayer]]]][:options]>;
To specify the auxiliarylayer in your own .cam files, you would set its value to "1" in the parameter list. As an example:
label<font<arial-bold,7,(255,252,249)>,5,100,50,1>;
You will now need to clear the GeoStream cache. For more information see here. |
The full listing of the modified code is shown below.
<%@ Page Language="C#" Src="AuthenticatedPage.aspx.cs" Inherits="AuthenticatedPage" %>

<html xmlns="http://www.w3.org/1999/xhtml">
<head>
<title>Simple Map Demo</title>

<script type="text/javascript" src="<% GetAPISource (); %>"></script>
<script type="text/javascript">

var main = function () {

    var GeoBase   = Telogis.GeoBase;
    var MapLayers = GeoBase.MapLayers;
    var Map       = Telogis.GeoBase.Widgets.Map;
    var Size      = Telogis.GeoBase.Size;
    var TileLayer = Telogis.GeoBase.MapLayers.TileLayer;

    // The call to set the internal GeoBase authentication token should be made at
    // the start of the entry function, as it is a prerequisite for any requests
    // made to the server.

    GeoBase.setService (<% GetService (); %>);
    GeoBase.setAuthToken (<% GetToken (); %>);

    // By default, a newly created map object has its DOM tree appended to the
    // document body. To customize where the map is located, either create in the
    // HTML section a div with the same ID, or specify a "parent" configuration option.

    var map = new Map ({id: 'main_map', size:  new Size (640, 480), tileLayerConfig:{tileConfig:{args:{auxlayer: '0'}}}});
    new MapLayers.TrafficLayer({map: map, id: 'main_map_traffic', source: 'TrafficData'});
    new TileLayer ({id: 'main_map_auxiliary', map: map, tileConfig:{args: {auxlayer: '1'}}});
};

</script>
</head>
<body onload="main ();">
</body>
</html>